We propose a novel method for encoding categorical features specifically tailored for forecasting applications. In essence, this approach encodes categorical features by modeling the trend of the quantities associated with each category. In our experiments, this approach shows substantial performance benefits — both in terms of forecasting accuracy and bias — as it allows tree based ensemble models to better model and extrapolate trends.
Introduction
The motivation for this work stemmed from numerous client forecasting projects at Artefact where our boosting models exhibited high bias at prediction time. Through a diagnostic phase, we identified that one of the main sources of bias in ensemble learning models arose from their challenges in accurately modeling trends and fluctuating levels.
In the following, we will demonstrate why and how we used a novel approach for encoding categorical features. Based on our experiments involving a client retail forecasting project and various public datasets, we prove that this technique can effectively mitigate bias and enhance accuracy.
Boosting and trends, why is it complex?
Boosting algorithms have a hard time extrapolating
Boosting algorithms have a hard time modeling and extrapolating trends since they cannot predict new values not seen in the training set / absent from the leaves. “Linear Tree” models try to alleviate this issue, however our tests yielded inconclusive results with this method.
Classical encodings push towards static predictions
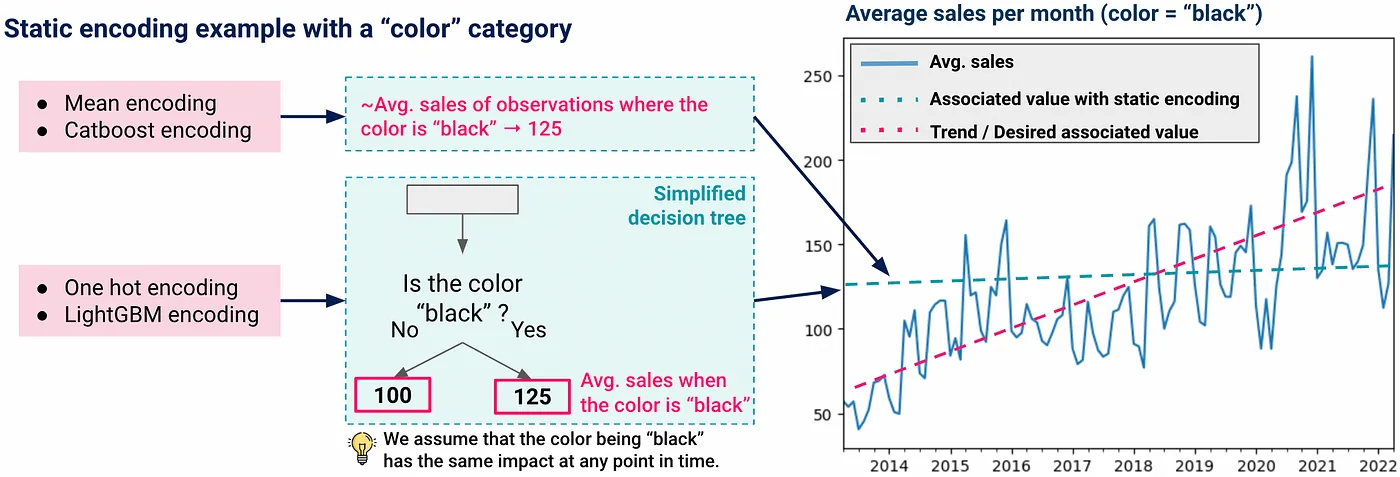
The most common encoding methods employed in boosting promote static relationships between independent and dependent variables, which in turn contributes to increased bias in the presence of trends. The diagram below illustrates this phenomenon:

Simplified visual representation highlighting the static nature of categorical feature encoding employed in boosting algorithms
We acknowledge that the above representation is an oversimplification, as decision trees are more complex and capable of identifying nonlinear relationships based on multiple factors. Indeed, the “color is black” condition could be associated with “the month is June.” In this case, the color being black would not have the same impact at all times. But let’s look at the bigger picture:
Our novel approach: Dynamic encoding of categorical features
Basis of dynamic encoding (v1 without item level)
In one sentence, our method for encoding categorical features could be described as: we model the trend component of each category and use these trend values to encode that categorical feature.
The diagram below illustrates the difference between a static mean encoding and a trend based encoding for two color categories: black and gold.

Illustration showcasing the dynamic encoding principle, which involves trend modeling for each category
In our experiments, we opted to use Prophet for extracting the trend component. Naturally, it is possible to consider other time series forecasting models as well.
Note that the static mean encoding implies that black item sales are at an average level of 100 units/month at any point in time. The dynamic encoding, on the other hand, allows accounting for the increasing trend seen on black items and is able to extrapolate it in the future. A similar statement can be made regarding gold items. Thus, our approach will be especially useful in datasets where the target variable to be forecasted follows steep trends across the various available categories.
Our primary focus is on enabling the model to adapt more easily to the changing relationships between independent variables and the dependent variable to be forecasted. Therefore, this dynamic encoding method could also be applied to numerical features. Consider the example of price. Although the price is numerical and the model can directly build rules based on it, people’s preferences for inexpensive or costly items may still evolve over time and follow a specific sales trend. In the context of an economic crisis, for instance, affordable products might follow an increasing sales trend, while expensive ones might follow a decreasing one. Viewing ‘affordable’ as one category and ‘expensive’ as another, we could propose a dynamic encoding for the price feature, just as we did for colors.
It is important to note that for numerical features, both the base variables and the dynamically encoded ones can be used in the model, as they will provide different types of information.
Giving more importance to dynamic features (v2 with item level)
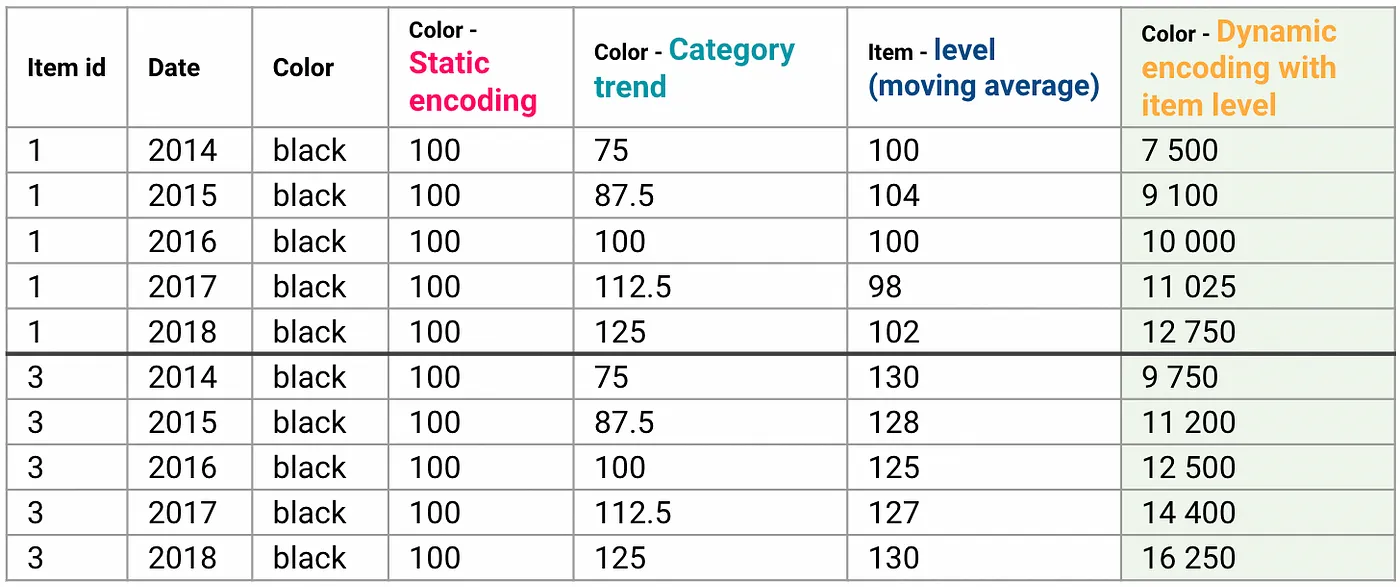
While this new encoding method is an improvement, often the importance of categorical features is not high enough to significantly impact predictions when examining feature importances. To give the dynamic features more importance and thus promote better modeling and extrapolation of trends, we adapt the encoding values to each time series / item individually.

Formula representing the two components of dynamic encoding: category level and item level
Returning to our color example, given two different black items, this allows for the dynamic encoding of the “black” category for each item to be different based on its individual past sales.

Table illustrating the calculation of dynamic encoding through a simple example
Experiments and results
Client dataset
We used our approach to forecast sales for one of our clients in the retail industry. We thoroughly validated our method across an extensive range of scopes to ensure its effectiveness. Here are some data points regarding the experimental context:

Overall, the method proved to be highly efficient, resulting in an average absolute decrease in bias of 9.82% and an average absolute increase in forecast accuracy of 6.29% across the 9 product scopes and 5 cross-validation folds.
The next section validates our method’s relevance by testing it on a public dataset.
Public store sales dataset
In this simplified case study, we use the Store Sales — Time Series Forecasting Kaggle dataset. This dataset exhibits a steep trend when examining the average sales time series, making our method particularly relevant. Additionally, the chosen prediction horizon is three months, which is distant enough to benefit from the extra extrapolation capabilities of the dynamic encoding. For demonstration purposes, we limit the dataset to March 31st, 2016, right before an earthquake occurred, causing the sales curve to flatten.
Prior to any encoding, our initial dataset comprises approximately 75% of numerical features, encompassing Lags, Rolling means, Calendar features, and Holiday events. The remaining 25% consist of categorical attributes such as product family, store number, city, and others.
Two distinct models are trained: one employs the categorical features that were dynamically encoded using our custom method, while the other uses LightGBM’s native handling of categorical features.
Upon comparing their performance, we observe a significant enhancement in the dynamic encoding approach. The following table provides a summary of the results:

Comparison of RMSE, FA, and %Bias between LightGBM encoding method and dynamic encoding

Average weekly sales + 3 months predictions (dynamic encoding vs LightGBM encoding method)
As depicted in the above graph, the model incorporating dynamic encodings effectively captures the trend and extrapolates it, whereas the alternative model struggles to accomplish this.
Usage and limits
Our method proves to be especially valuable in scenarios where the time series displays pronounced trends and the prediction horizon is distant enough to benefit from trend extrapolation. Moreover, as we dynamically encode and incorporate more categorical features with significant predictive power into the model, the effect achieved through our approach on predictions increases. However, it’s important to acknowledge that other encoding methods have their own advantages and may be more advantageous in different contexts. Furthermore, there is the possibility to combine both encoding types for potentially better results.
Conclusion
We have plans to publish a paper in the coming months, which will include complete details of our approach and implementation. Stay tuned for further updates!

Interested in Data Consulting | Data & Digital Marketing | Digital Commerce ?
Read our monthly newsletter to get actionable advice, insights, business cases, from all our data experts around the world!
 BLOG
BLOG


