GLADS – 5 choices you need to make before starting modeling

TL;DR
Demand forecasting is always challenging, we all know that. In this series of articles you will understand the main challenges of developing a complex forecasting model on a real world problem. Our model has to beat baseline predictions made by demand planners in terms of forecast accuracy and be easily deployed to other countries. First, we would like to provide you with useful tips regarding the choices you should make, before training your own model.
What to expect from this series ?
We aim to provide you with insights and good practices that go beyond things you might find on Kaggle competitions. The problem with online forecasting competitions is that they often omit real world constraints like corrupted data, data not available in advance, etc.
Each article in this series will tackle a challenge that you might encounter, for which there are no clear answers on Kaggle discussions:
The GLADS framework
Demand forecasting has been a powerful tool to help companies on decision making, logistic optimization as well as business insights learning. However, it remains a challenge to have an accurate and robust forecasting model, machine learning based approaches struggle to be applied on real business due to different constraints. The challenge may rise from both the business side and the data side. To help business owners and data scientists overcome these difficulties, we have summarized five choices you need to make based on our experience. We call it GLADS, which stands for:
In the passage, we will briefly explain what, why and how we chose GLADS.
G: Granularity of data
What is it?
Granularity of data is how detailed your sales description will be. It usually comes in two dimensions: items and time (frequency). For example, do you describe your sales by SKU / category / BU / Country? Do you record your sales by hour / day / week / month / year?
Why is it important?
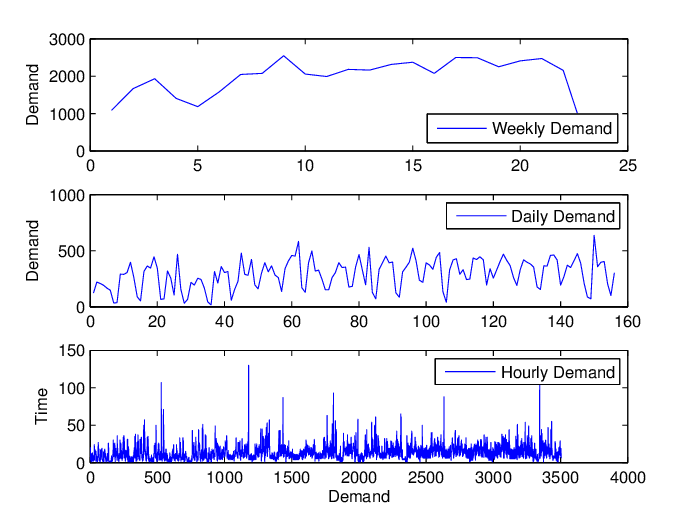
While the more detailed the raw data are, the more options that the Data Scientist can work around for sales forecasting, choice of the granularity is not that straightforward. Apparently, a higher granularity can keep more information when describing the sales, however, it can also bring about a large amount of noise into the data. Choosing the right granularity is a necessary step to denoise the data and to keep as much information as possible, which can build a solid base for the next modeling steps.
How to Choose?
The granularity should be chosen by considering two main factors: business need and data characteristics itself.
Based on your business need: Business need is always the first thing that should be taken into consideration. In some cases, monthly sales would be enough whereas in other cases, you might be asked to predict sales for each single hour. The business need varies a lot in different industries, and please make sure you start building the model after understanding it first.
Based on data characteristics: Bricks cannot be made without straw, if the granularity of the data conflicts with the business need, the first idea that you come up in mind should be collecting the data in another way. Although some algorithms can help you to elevate the granularity of your data by simulation or machine learning, building a model using pseudo-data brings you too much uncertainty. Nevertheless, aggregating the data to lower granularity is sometimes necessary, in these cases, the data are too unstable with a high variance, data aggregation can be a useful tool to stabilize the data and increase the performance of your model.
L: Length of horizon
What is it?
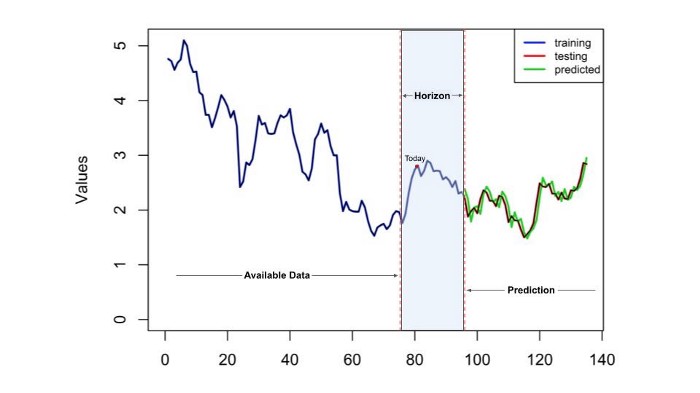
The time Horizon of your forecasting model is basically how long in the future the prediction should perform. If we prepare a forecast with the time horizon of two months, then it means our model would give the predicted result two months from current time with a certain granularity.
Why is it important?
While the accuracy of the model is often used as the only performance metric when evaluating a forecasting model, time horizon can be essential when applying the model in the real world. Just like weather forecasting, one can always reach a better accuracy when predicting the temperature in the next few hours than that of one week after. It is the same case when it comes to sales forecasting, the longer the horizon is, the lower the accuracy would be. However, for business applications, it would be the opposite. Normally, there is no need to predict the sales of the next coming day since few decisions can be made and executed during the night whereas it could be very helpful to know what will happen in the following weeks or months. Don’t be blind without having a time horizon in mind and build a model that cannot be applied in the real world.
How to choose?
The length of the time horizon will fully depend on business needs. For example, if the forecast is going to be used in order to help optimize warehouse scheduling,then forecasting sales for the next day might not be of help. Thus the forecast horizon should be set based on how long it takes from knowing the future to actually apply the action. Or to put it more frankly: how much should you know numbers in advance? As a reminder, a horizon which is too long can decrease the quantity of training samples you have if the time coverage of the data is not long enough.
A: Algorithm for prediction
What is it?
Sales forecasting approaches have been evolving for years, thus the diversity of the algorithms. While the most popular tools when talking about sales forecasting are ARIMA from statsmodel and Prophet, tree-based regression models have also been applied on sales forecasting tasks. Meanwhile, deep neural networks have never been out of the list of candidates whenever machine learning is applied.
Why is it important?
It may not be the job of a Data Scientist to develop a brand new algorithm for a special task, the main challenge for them nowadays goes to choosing the right algorithm and the customized data processing for the algorithm. Choosing an algorithm without considering the available data, the business context or the requirements on the transparency of the model would probably turn the model into tons of parameters staying in the server with no proper application.
How to Choose?
Before choosing the best algorithm in your case, here are some general concepts that should be known for each branch of the algorithm.
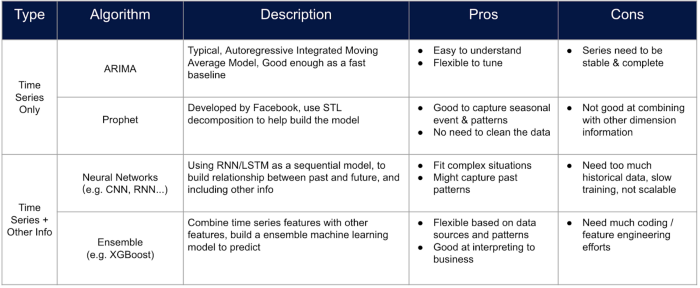
ARIMA: ARIMA is used to build a model for a time series using purely classical statistical methods without other features that can represent the characteristics of the sku.
Prophet: Prophet is an advanced forecasting tool designed by Facebook, which can customize the events and the festivals, however, no static features can be added.
Both ARIMA and Prophet cannot build a model for multiple time series and the error will be stacked with as the horizon increases.
Tree based models: Tree based models are often used for classification and regression problems, however, it can also be used for time series forecasting through some special data processing tricks. One can build a table where each feature represents the values of the series on the specific time stamp, and the forecasting can be made by rolling the time of prediction with the time window. Tree based ensemble models are now one of the most efficient ways when building a sales forecasting model since one can customize more features into the model without too much work on feature engineering.
Neural network: Neural network methods are never out-of-fashioned because of its performance. One can always build a neural network like LSTM with similar feature engineering processes with tree based models. However, the transparency of the model, the amount of data needed and the training efficiency should always be estimated before such approaches are applied.
D: Drivers of sales
What is it?
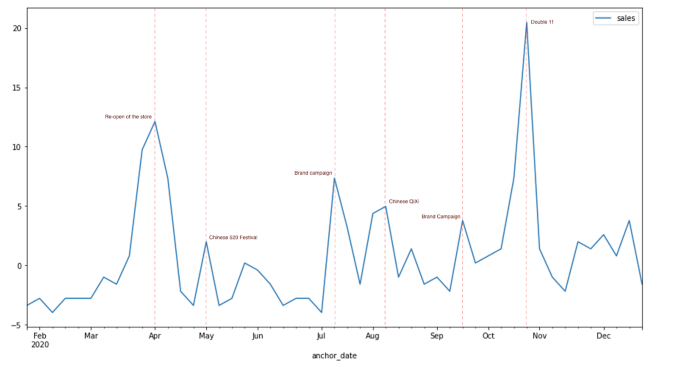
It is a common knowledge in business, that the sales of an item can be hugely influenced by other factors (holidays, events, campaigns, media, weather, etc). When you are able to catch these drivers, you might have a better chance to improve the forecasting with the driver data, especially when some of the drivers could be known or set prior to forecasting.
Why is it important?
Sales forecasting models can hardly achieve a satisfactory performance if they only use history sales because customers’ behavior can be influenced by too many factors. The sales of a supermarket might be influenced by the weather, and the sales of a cosmetic brand might be pulled by the campaigns. Based on our experience, the impact of different drivers can be so strong that the sales are sometimes doubled during the festive season and it can cause huge errors on the model prediction. Nevertheless, analyzing the impact of drivers is always an interesting topic for both marketers and the logistics department, what are the key factors that master the sales? How would the sales change if a big campaign is scheduled in the future? And how to optimize the logistics under different scenarios?
How to Choose?
Transformation to time series: Given the data related to potential drivers, the first thing we need to do is to transform these data into time-series so that we can analyze the co-relationship between the driver and the sales of one sku. However, this can be really tricky. The easiest way is to encode a group of events as a binary variable indicating whether at least one of these events happens during a certain period of time. Based on that, the events can be encoded as a numerical time sequence, too. For example, the number of events on the same day, the number of cities where the events happened on that day, etc. Some customized-transformation can also be added such as using other forms of waves instead of square waves according to the business experience.
Study of correlation: Next, we need to study the correlation between two time series. We suggest using TLCC (Time Lagged Cross Correlation) as the effect of an event can appear before or after the event. For example, campaigns usually take effect several days after the launch while people tend to prepare the gift one week before the festival. As a result, the offset can be positive or negative, while the absolute values need to be limited based on business experience, otherwise it would be too difficult to explain why today’s sales are impacted by the Christmas of 2018.
S: Sets of SKUs
What is it?
Most of the time, the sales data are gathered by SKU (Stock keeping unit), so an important question when building a forecasting model on SKU-level is whether to train an individual model for each SKU or to use all the available SKUs to train one model. While the former focuses on one single SKU and differentiates the characteristics of it, the latter benefits from the huge volume of the training data and saves space for stocking the parameters of models.
Why is it important?
The reason why we can train the model with all SKUs is that most of the signals learned by the model are similar, therefore, if we are able to maximize the similarity among the data we use for training, we can optimize the trade-off between the respect of the particularity of each sku and the volume of the training data.
How to Choose?
Based on that assumption, we suggest two different methods to group the SKUs.
Business way: Since the sales of one category can be similar, grouping the SKUs by their categories would be a practical way to benefit from the common patterns among certain SKU. Sometimes there are even sub-categories that you can leverage to find the best cut of SKU.
Data science way: A data science way to group the SKUs is to apply clustering algorithms. In the previous section, we have mentioned about the analysis of the correlation between SKUs and drivers, we can utilize the same method to calculate the correlation across the SKUs. In fact, the correlation can be considered as distance, clustering algorithms can be thus applied to the distance matrix across all pairs of SKUs, then the model can be trained individually on each of these clusters.
Conclusion
As a conclusion, here is a short version of “GLADS” to keep in mind when you make forecasting choices:
At the end of the day, these choices would only be able to help you get on a good head start at the beginning of a forecasting project, or help fine tune the methodology along the way. But the devil is in the details, and we will post later on some more detailed methodology related to this topic. After all, there’s no end game in forecasting, there’s always the need to do better.

 BLOG
BLOG


