After spending time in my first story on code optimisation to reduce my computing time by 90%, I was interested in knowing the CO2 equivalent saved by my changes. Inspired by the Microsoft DevBlog, I decided to develop my own method based on Sara Bergman article.
During this article, we will run through every phase of the process that can be cut into three different parts :

Each part will be accompanied by their actual implementation on a notebook in Azure ML Studio.
Step 1: Profiling the code
The goal of this first step is rather simple : finding the memory and CPU consumption of your code. In the case of our machine, three main parameters will be taken into account:
We can easily find information online to approximate Power Usage Effectiveness (PUE), but measuring the CPU / Memory consumption of our Python notebook is not that straightforward. Many solutions exists (timeit, cProfile, psutil) but are rather focused on Time profiling than CPU and Memory consumption.
For the sake of ownership and simplicity, I decided to code my own profiling script in Bash, measuring my machine consumption in a forever loop, as the code I needed to assess was located on a JupyterLab instance running on Linux (18.04.1-Ubuntu SMP).
The first script, used to measure every second the exact Memory usage was saved as memory_profiler.sh :

The second script, used to measure every second the average CPU consumption during the last minute was saved as cpu_profiler.sh :

But having those two script was not enough, as I needed to know exactly when my code was running as well. To serve this purpose I added a cell, at the top of my notebook :

And another cell, at the bottom of my notebook :

Now that everything was ready, I just had to :
1. Make sure that my environment was not polluted with other task running in the background and close every ongoing instances by hitting the Shut Down All button

2. Open up a terminal instance to run memory_log.sh script in the background
./memory_log.sh
3. Open up another terminal instance to run cpu_log.sh script in the background
./cpu_log.sh
4. Instantiate and run all my notebook cells

Once the whole notebook ran, I can stop both Linux script by pressing CTRL + C in each terminal, check if my memory.log and cpu.log files were successfully created, and note down the Start time and End time of the execution of my notebook leveraging the two added cells with datetime.now().

I now had everything I needed to take for next computation phase.
Step 2: Compute into energy
Now that we collected all the data on the resource consumption, we can start converting everything into kWh, mesure representing the energy consumption.
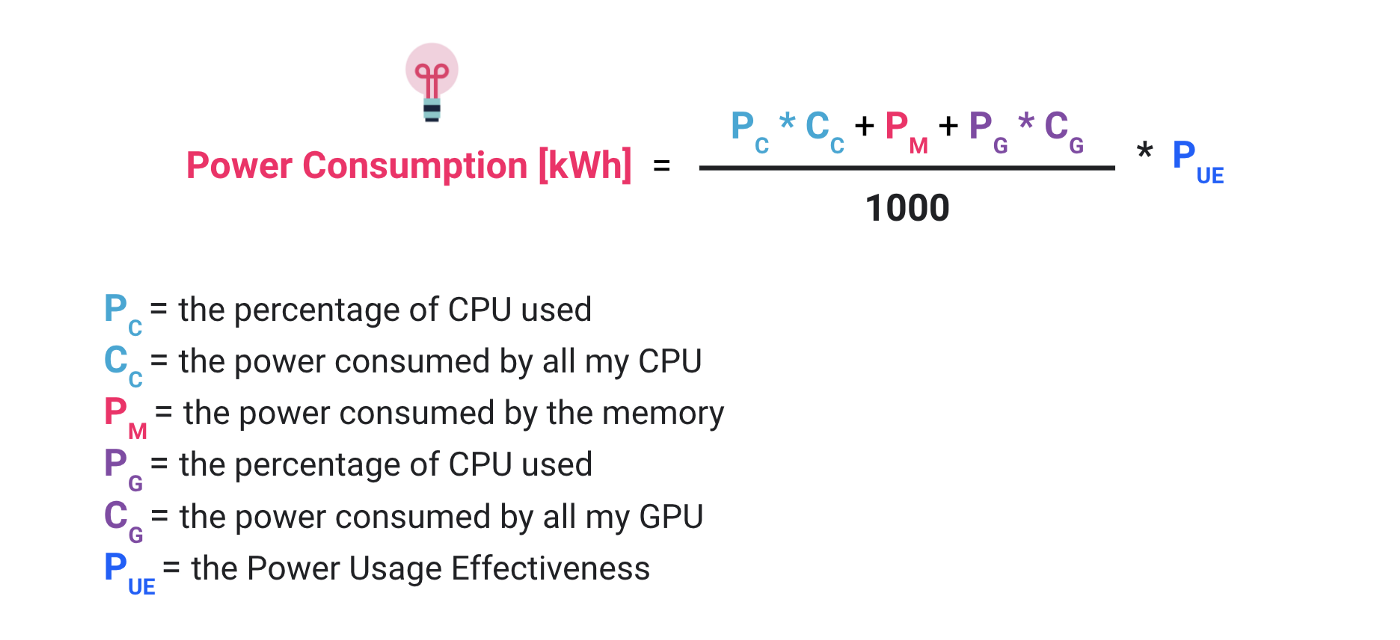
In order to achieve that, we will use the following equation:

Let’s first start the CPUs related metrics.
As a first step I copy the content of the cpu.log file in a Google Spreadsheet that I will later use to get my average CPU Consumption :

I do a few manipulations on my Sheet, (Split text to column, Delete unused columns, Add columns names) in order to obtain something more handy to exploit :

My Notebook ran from 12:33:20 to 13:14:09, so I can just add a formula to return the average of cpu_1 between those times, and divide that Average by the number of CPUs of my machine :

I now understand that my Notebook is using in average 8.038 CPUs during its 40 minutes of execution which correspond to 100.47% of average CPU usage.
But what’s the consumption of my CPU ?
It depends on the model of CPU used, I found more information on CPU used by my machine in the Azure Microsoft Documentation. At the time of my experiments (October 2021), my machine was using one of the 4 different type of Intel Xeon CPU :
– Intel Xeon Platinum 8270
– Intel Xeon Platinum 8171M
– Intel Xeon Processor E5–2697 v4
– Intel Xeon E5–2673 v3 @ 2.40GHz
After looking online on Intel website, I was able to match CPU models with their power consumption, using the Thermal Design Power (TDP) that represents the average power, in watts, the processor dissipates when operating at Base Frequency with all cores actives.

As the CPU used can changed over each execution of my code, I decided to pick the average TDP of these four CPU, which is 158.75 in that case.
I now have found both Pc (=1.0047) and Cc (=158.75)
Let’s now have a look at the memory.log file
Following the same processes as before, I copy the content of my file in a Google Sheet, split the text into column and arrange them to obtain the following format :

I then apply an average formula on the column C, to get the average use of memory between 12:33:20 and 13:14:09 in MB. I divide this number by 1024 to convert it in GB.

To estimate the power usage of one GB of data, I will follow a rule of thumb found here : 3W per 8GB so 0.375W/GB and 1.88W in total for my 5.015GB usage of memory.
I now have found Pm (=1.88). Note that the power consumed by my memory seems to be 85 less times important than the one consumed by my CPU and might be skipped to obtain a slightly less accurate but faster assessment.
As I don’t use any GPU, I can directly move to the last missing term : the Power Usage Effectiveness. PUE is a ratio that determines the energy used by the data center for anything else than hosting cloud services like cooling, reactive power compensation, lights …
Looking at the Microsoft Datacenter Fact Sheet of 2015, the average PUE in its new datacenter were 1.125. This is the number that we will take for this example, but a more disciplined approach will be to find the actual PUE of the data center used for our calculations.
We now have all the terms of our equation, let’s do the math!

As our code was running between 12:33:20 and 13:14:09, it took 40 minutes and 49 seconds to execute (which is equal to 0.68 hours). It mean that in total it consumed : 0.182 * 0.68 = 0.1238 kW
Step 3: Assess the impact
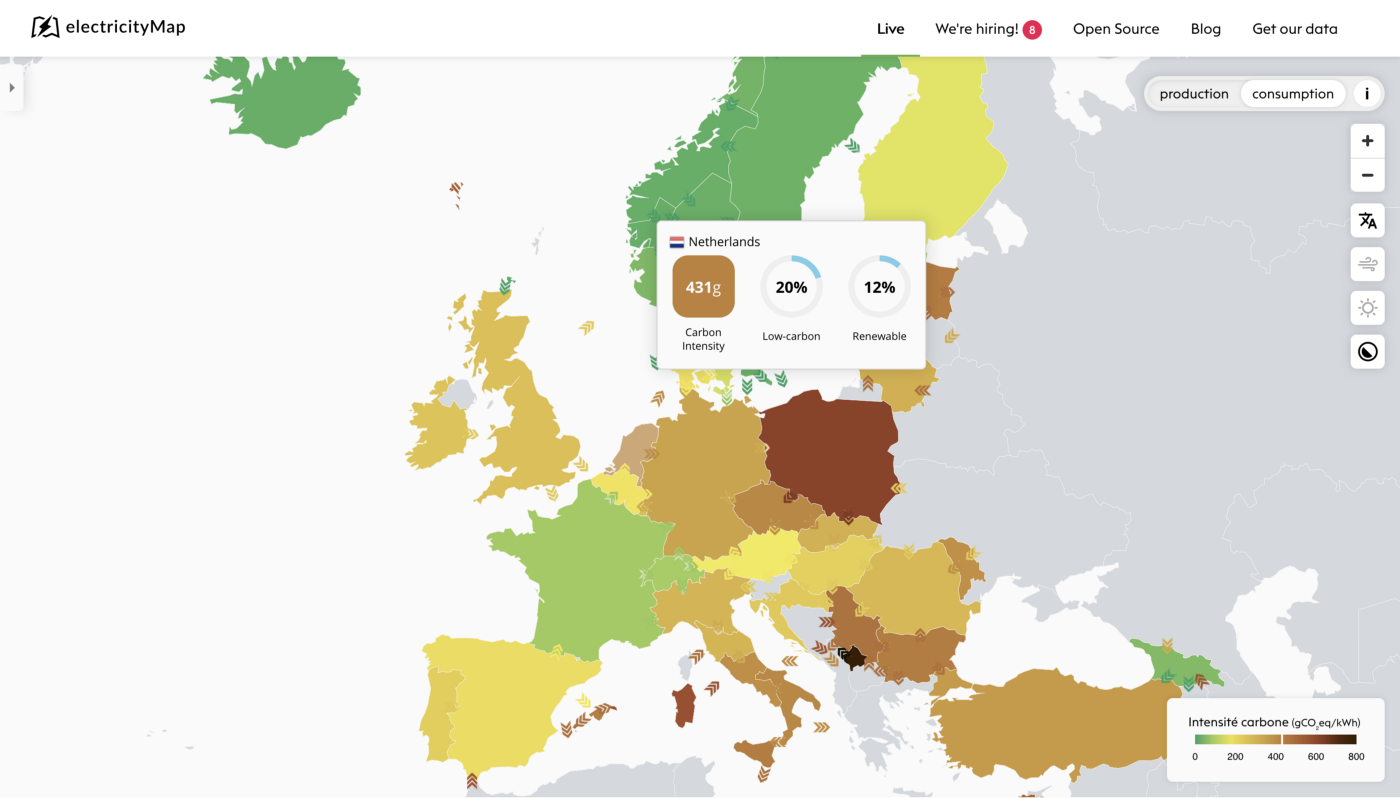
Last step of our Carbon Measurement journey, we now need to assess the impact of this electricity consumption which highly depends on the place where the energy was consumed. To compute it we will use the Carbon Intensity factor that we can easily find in Electricity Map website, a project to gather, preprocess and unify Public electricity data from 150 geographies.

When I computed the CO2eq impact of my Code running in Netherlands, the Carbon Impact value was at 487 grams per kW. That brings the impact of my code to 487 * 0.1238 = 60.3 gCO2eq.
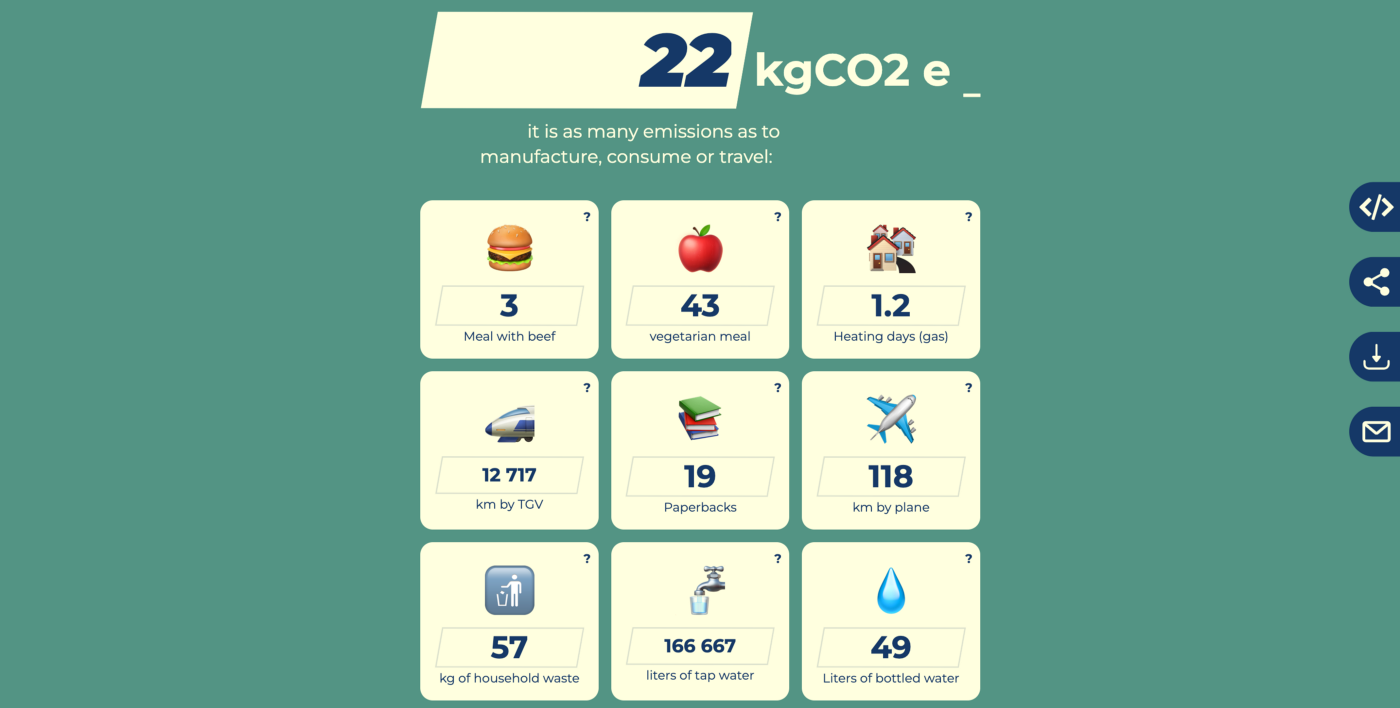
This value might seems low, but knowing that my piece of code was running everyday and all year long the impact was brought to 60.3 * 365.25 = 22.0 kgCO2eq per year.
But what does it represent compare to others activities ? If we compare it to the use of a car for example and take the 2019 average C02 emissions for all new cars, it’s equivalent to the footprint of a 180km trip.
Using monconvertisseurco2.fr I’m able to get more equivalent activities using “Base Carbon” open data, gathered by an organisation of the French state : the “National Agency for the Environment and Energy Management” or ADEME.

Conclusion
We did it!
After a Profiling our code to get both the memory and cpu usage, computing those numbers into electricity consumption and assessing the impact into CO2eq, we managed to better understand the carbon footprint of our code. This is an important milestone to take a step back on the environmental impact of our code, and to highlight the importance of code optimisations.
In this specific case, as mentioned in the part one on how to track and avoid performance bottleneck in Jupiter Lab, just optimising a line of code allowed me to save 90% of my computing time and 92% of my CO2eq impact, moving from 22kgCO2eq to less than 2kgCO2eq per year.
Nowadays most of the cloud provider platform, including Azure, promises to have a neutral impact on the environment thanks to carbon offsets projects. However environmental experts agree that, while effective and important, carbon offset projects alone are not enough to control the impact of our activity on the planet, and that the best solution is still to reduce emissions at the source, as in this optimisation project.
This is what we try to promote at Artefact through our different environmental initiatives!

 BLOG
BLOG


