This guide will help you figure whether Prophet is appropriate or not for your forecasting project, by giving you a critical opinion based on a real project lens. We tested it on 3 main dimensions: feature engineering and modelling, interpretability, and maintenance.
We tested Prophet in a real-world project, on 3 main aspects: feature engineering, interpretability, and use in production & maintenance and here are our conclusions:
Feature engineering and modelling:
Interpretability:
Stability of the results / Maintenance:
Introduction
Recently, an article pointed out that Facebook Prophet was performing poorly on some edge cases. Indeed, this package is so popular that it tends to be considered as THE go-to tool for every forecasting use case. This launched a debate within the community and even its creator reacted.
There is a lot of literature on how to make a single forecast with Prophet. But there is a lack of empirical feedback on how it behaves in production, when you need to provide forecasts on a daily basis. We have tested and proven this tool for 6 months on a real business project. Here are some takeaways.
We used Prophet to forecast call arrivals in call centers for one of the biggest Telecom companies in Europe, to optimise the quality of customer service.
We applied the GLADS framework to draft our data approach:
An important constraint was the need for interpretability of results. Indeed, our predictions are consumed by human planners whose goal is to maintain a SLA (X% of calls must be answered in a given period) while minimising costs. Their work consists of 3 missions:
Main call drivers differ depending on SKUs. For example, Commercial assistance drivers include:
Our time series have strong seasonalities, and follow economic cycles. They are not stationary. In this case, Prophet is an appropriate choice. We chose to test it, as well as other ML algorithms frequently used for this task.

Feature engineering and modelling
Prophet has many undeniable advantages that are especially useful for a business-oriented forecasting project, and which fully justify its popularity.
One of them is its ease of use. Only a few lines of code and almost no feature engineering are needed to have a good baseline. To learn more about how it works and how to use it, read this Twitter thread from its creator, as well as this excellent blog post (with code).
Time features, such as trend and seasonality are created natively — Exit the rolling means, lags, and other tricky features required by machine learning (ML) tree-based models.
However it can be quite a hassle to fine-tune if multiple events disturb the signal.
Trend
A great advantage compared to autoregressive models (eg. ARIMA) is that Prophet doesn’t require stationary time series: a trend component is generated natively.
For these reasons, Prophet works quite well for middle-term predictions (we tried it at M+5 horizon), even though the confidence interval is quite large.
Trend can be correctly estimated without any external data (such as the number of customers). This is quite powerful, because when you predict call arrivals, you don’t know how many customers you will have in 5 months, so you cannot use this feature.
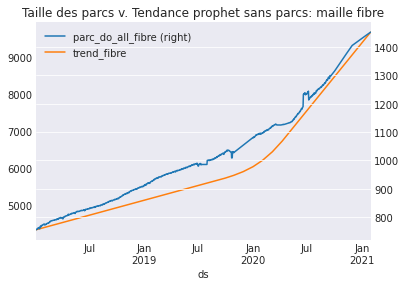
For instance, this plot shows the number of Fiber-Optic Internet (FIO) customers over time (a growing market for our telecom company), compared to the trend component learned by Prophet on call volumes. There is a strong correlation (Pearson coeff.: 0.988) between the volume of calls and the number of clients. So the model learns the trend well, and only from the time-series itself.

We identified some tips and tricks to make the trend a real benefit in your Prophet based forecasting.
Trend: Watch your changepoints
One of the strengths of Prophet is also a weakness for the stability of the results and the performance: The trend component tends to explain the vast majority of the prediction — around 90% for our case study. Thus, if the trend is not well estimated, performance will dramatically drop and you can lose over 20 points of MAPE by over or under predicting over time. You have multiple parameters to help Prophet adjust the trend, including the `changepoint_prior_scale` and the `changepoint_range`
Finding the right changepoint_prior_scale value is essential, because this parameter sets the flexibility of the trend. The higher it is, the more flexible the trend. Our strategy is to grid search this parameter with these values (in a logarithmic scale): [0.001, 0.01, 0.1, 0.5]. Having relatively small values will generally lead to better generalisation.
Trend: Make the most out of the most recent data
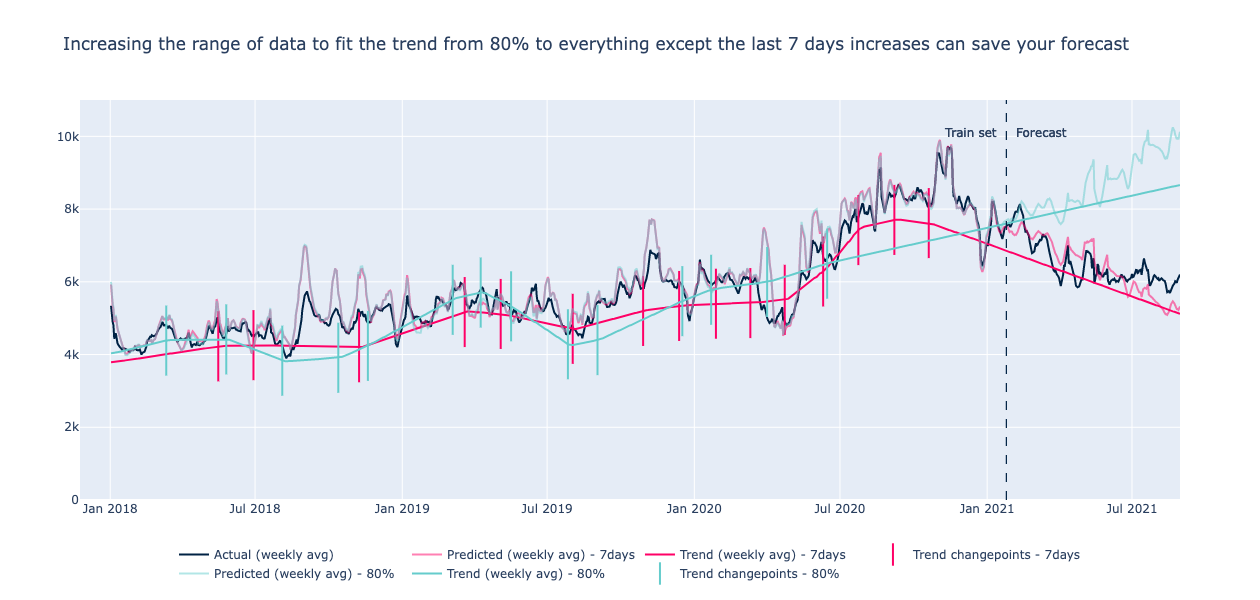

Next point of attention: by default Prophet takes into accountonly the first 80% of the history to approximate the trend by specifying 25 potential changepoints. We found that increasing this value of 80% by changing the changepoint_range parameter was improving performance. Indeed this will also take into account the latest data, which are more important to explain the level of calls in our case. For instance in this graph you can see that 2021 data is important because it has a decreasing trend. We chose to take into account the whole training set except the last 7 days instead of 80%.
Trend: Clean your outliers
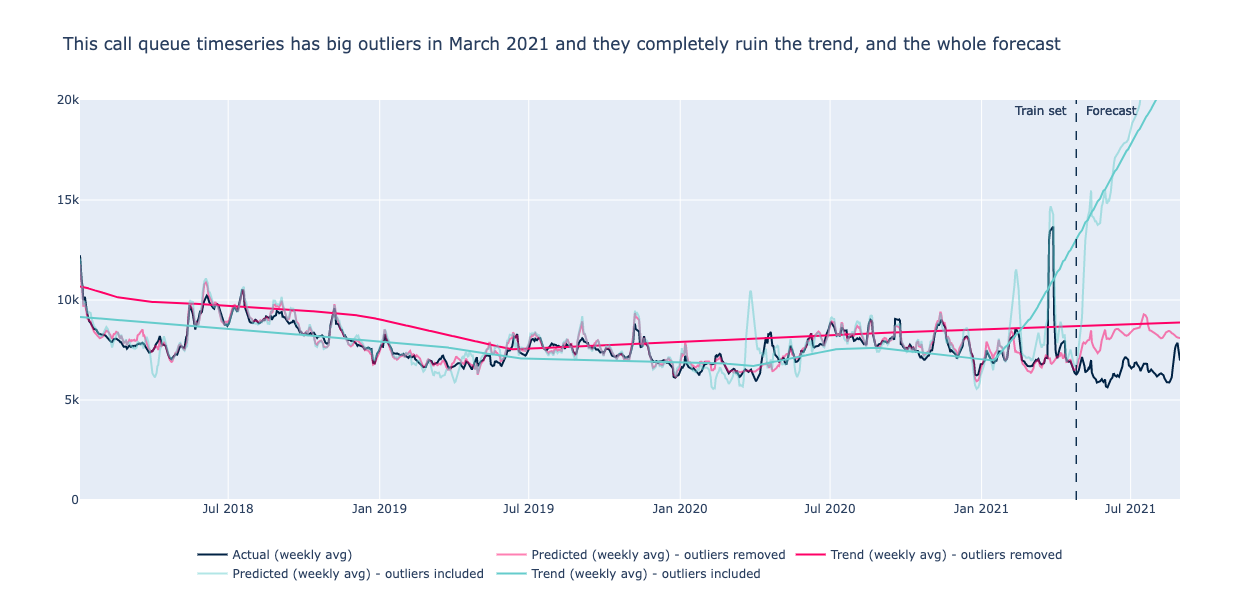
Another thing to consider is the sensitivity to outliers. The official documentation recommends removing them: “Prophet is able to handle the outliers in the history, but only by fitting them with trend changes”.

Seasonalities
Seasonality components, such as daily and yearly, are estimated with Fourier series. Because our time series have strong seasonal business cycles, we found that Prophet works quite well.
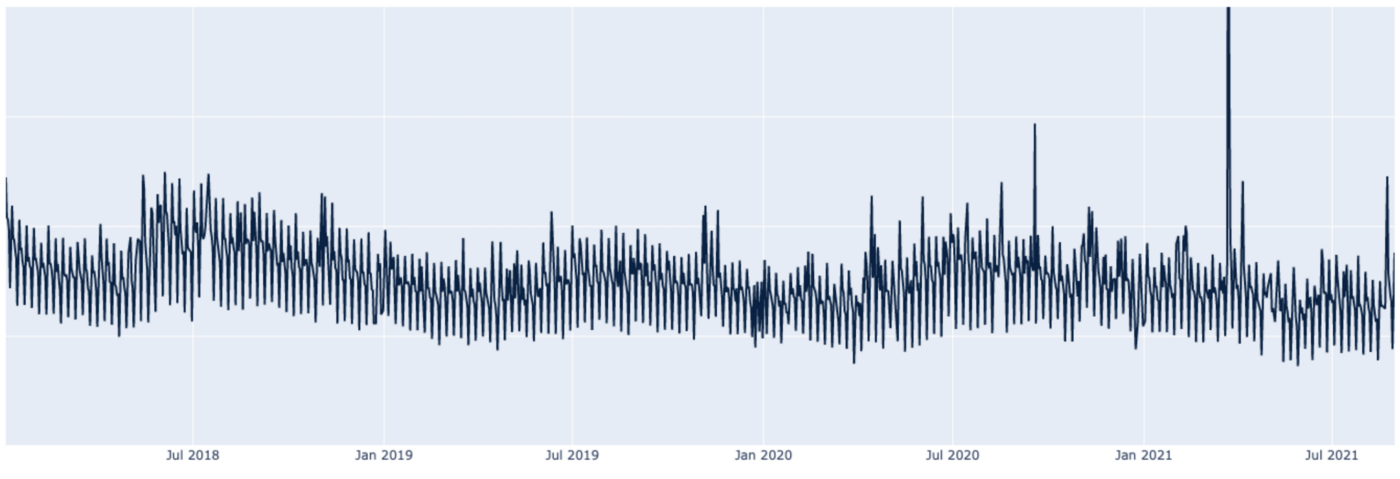
But when we deep dive a bit, we found that weekly seasonality modelling is limited. Our time-series had very low Saturdays compared to the rest of the week (and no values on Sundays). We spent a lot of time and had a lot of trouble trying to improve our predictions on this particular day of the week.
We Finally had to use a workaround: stacking two models, including our Prophet model and a statistical model computing predictions based on the average weight of week days over the last 6 weeks. And this despite having tried to change all parameters in Prophet’s weekly seasonality.
Our understanding: On a 7-days-period seasonality (6 in our case without Sundays), Increasing the Fourier order is not that useful, because the interval between 0 and 2pi is only divided in a few segments (6 or 7). And a low Fourier order means that it cannot fit extreme values and rapid changes in seasonality, like Saturdays in the example above.
Some other tricks to fine-tune seasonalities:
Events and extra regressors
For events and extra-regressors as well Prophet can be handy.
You can add extra-regressors, either continuous or categorical, by providing another time-series (values and dates) to the model with the add_regressor method. Events are managed as categorical regressors (value is either 0 — the event is not happening on that day or hour — or 1 — the event is happening).
Adding new events is easy: you only need to provide Prophet with a dataframe that contains the dates and names of events.
It worked quite well with holidays, vacations, and other events. And it tends to give better results than the tree-based models.
On top of that, Prophet is using the Python holidays package to allow you to only use the id of the country (USA or FRA) to add related holidays as a feature.


As with many other time series prediction algorithms, it is often difficult to know whether a recurring event is already included in prophet’s seasonality or whether it needs to be flagged manually to help the algorithm. A simple example is the Christmas and New Year period: same period, roughly same effect, every year. A tricky one is french spring holidays. In France, around April, there are two-weeks school holidays with moving dates from year to year, and divided by geographical area (not all of France goes on holiday at the same time).
While the yearly seasonality is low during this period, the effect of a “spring holiday” event is positive on call volumes predictions. And the model performs better with this event. So the effect of this event is inconsistent with other holidays and with the seasonality we observe, but there is an effect on model training and predictions that improves performance… Should we add it or not?
We observed similar issues with various public holidays that are moving around every year, and we sometimes had to stack Prophet with a statistical model to better fit holidays’ effects. However, we do not have any consistent solution to offer.
Feature crosses are time-consuming and often over-engineered
As Prophet is a roughly linear model in the way it handles extra-features and events, feature cross is not automatic. Meaning that Prophet cannot infer that a combination of values of different features will lead to an exponentially higher or lower impact on prediction, whereas it is something that tree-based algorithms and Deep Learning can infer very well.
Example: let’s say that you have an impact on your time-series at Business Day + 1 after a holiday (HBD+1). Then providing Prophet with an event “HBD+1” will allow it to better fit this effect. But here, the impact depends largely on whether the day HBD+1 is on a Monday, Saturday etc. And It is not linear nor multiplicative. Hence you’ll have to add all the features “HBD+1_monday”, “HBD+1_tuesday”,…
When crossing features, their number grows exponentially and it is going to cost you both time to compute them, a loss of interpretability, and probably a drop in performanceif you add too many of these features.
Interpretability
One of the key advantages of Prophet over other models is its interpretability.
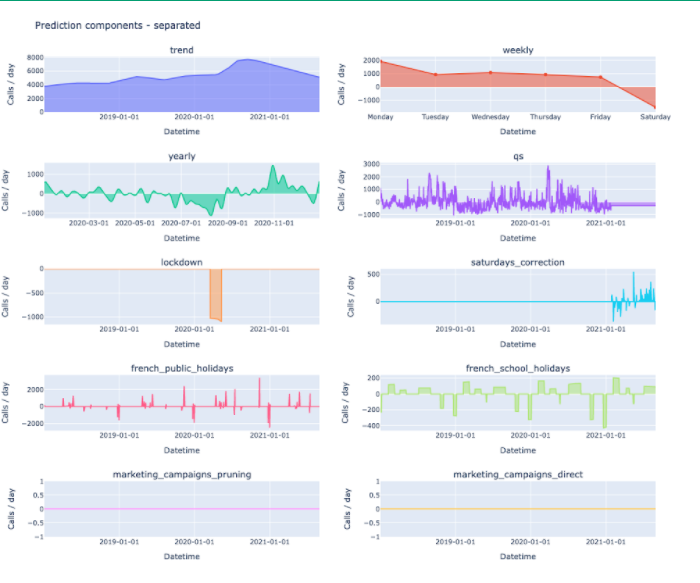

The native decomposition of the forecast into trend, seasonalities, events and extra-regressors components is meaningful for low-tech profiles.
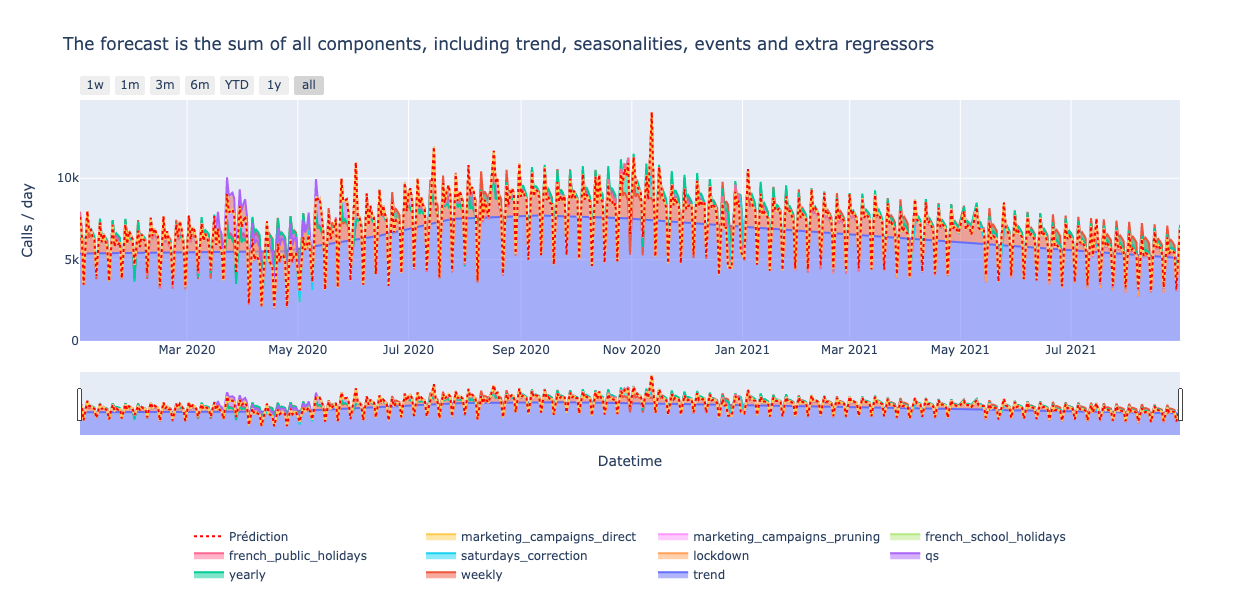

Prophet is an additive model : the sum of each component equals the prediction. Each component importance is expressed directly in the target unit(unlike SHAP values). And it provides both local and global explainability.
Consequently, it is really easy to plot the prediction / impact of each component on the forecast. If you choose to switch to a multiplicative mode, where every component is expressed as a percentage of the trend, you will have a little more work to do, but it remains very easy to plot.
Unfortunately all these components only provide about 10% of the prediction, the remaining 90% being predicted in the trend… which is almost unexplainable. It will be your job to try to explain the trend using external regressors that you cannot use as features for Prophet, such as customer base growth, contact rates, and changes in customer behaviours for our case study. To do so, you need to have the actual values associated with each one of these features: hence it is only possible to analyse your trend when you look back to the predictions made in the past.
Performance and maintainability in production
Performance
Prophet has very quickly good performance, compared to the development time. In other words, it offers a good baseline quickly, as you don’t have to craft time features.
Prophet makes it possible to forecast time series with almost no feature engineering and a good level of performance, in record time.
It trains fast: it takes less than 1 minute per model, with cross-validation, on a dataset with ~3 years of data on a macbook Air with M1 chip and 8 Go of memory.
In production as new data comes in you need to re-fit your model. A way to speed-up the training is to warm-start the fit, using the model parameters of the earlier model. You can also use this feature to accelerate the cross-validation process. Check the section “Updating fitted models” on the documentation to go further.
Prophet needs at least two years of data to compute yearly seasonality, but we recommend having at least 3 years of historic data to have good performances.
We achieved a performance of ~15% MAPE after a few iterations. Fine-tuning results however was quite challenging and it was hard to bread this ceiling. We had to develop some custom corrections on the output to achieve a ~10% MAPE.
In our project Prophet and XGboost have similar performance metrics in the M+1 and M+2 horizons. However, the performances in M+3 and M+4 tend to degrade more on Prophet compared to XGboost. This is because the trend wasn’t correctly estimated. While it doesn’t impact short-term predictions, long term forecasts are heavily affected by the trend direction, as it keeps growing or decreasing over time, which leads to over/under prediction. Using another approach for long-term forecasts is probably safer.
Interestingly, sometimes adding more historical data can be counterproductive and lead to a drop in forecast accuracy. Prophet does not allow to put more weight on the most recent observations, so more data can lead to a decrease of forecast accuracy.
Here the tip would be to conduct experiments with several lengths of historical data and select the one that yields the better results.
Stability of the results
Despite some undeniable advantages, Prophet is not a plug-and-play model. It requires some time to fine-tune it to boost performance. Some weaknesses make it hard to rely on its stability in production.
To assess how often we would need to re-train the model, we compared 2 strategies. We generated forecast on different months and measured the results:
Re-training the model every month had better results. In conclusion, despite the temporal cross-validation the hyperparameters were not stable across time. For XGboost you don’t have to do such retraining frequently. However, these results should be treated with caution, as the volumes were impacted by the COVID crisis at the time we made this benchmark. Here again our intuition to explain the result was that the trend is hard to estimate correctly.
Scalability
One of the drawbacks of this univariate model is that you need one model per SKU, compared to tree-based approaches where you can use the same model for many products.
Usually it leads to better performances, as Pierre-Yves Mousset pointed out on his project. However, having many models can be an engineering challenge and a nightmare to maintain.
Conclusion
Prophet ease-of-use made it a very good baseline model when your timeseries easily breakdowns into simple temporal components. However if your signal is noisy, fine-tuning the model’s performance can be a hassle.
Thanks to its native breakdown of the forecast into time components, the model decisions are easy to interpret. Nevertheless it’s not precise enough to be used to measure the impact of an external event, because you never know if the effect of the event is already taken into account in the native time components.
If your timeseries follows some business cycles, you can obtain very decent performance quickly, without intensive feature engineering. However the trend component is not always well estimated, and this can create significant performance drifts. For this reason, this model can require careful monitoring and frequent human interventions.
If you want to provide some explainability and build a decent model easily and quickly, Prophet is an option to consider. However if you care about stability and forecast accuracy, consider using another kind of algorithm, such as tree-based models, Orbit or DeepAR.

 BLOG
BLOG


