The Challenges of Data Overload
Have you just come out of another meeting where the focus was discussing which number was correct, instead of debating the best paths to business success? If you answered “no,” consider yourself privileged. The reality for many organizations, whether small or large, is to waste precious time trying to figure out which information is correct to support strategic decisions. And when the need arises to deepen analysis, such as details about monthly sales, another 3 days of analysis and 2 days of validation go by, which ends up delaying critical decisions.
In this context, it is impossible to ignore the impact of Generative Artificial Intelligence tools, such as Chat GPT, Copilot, Deep Seek R1, Claude 3.7 Code Builder, and Manus AI. You certainly follow market news and realize how these technologies are transforming the way we work with Technology, Data, and Business Intelligence (BI). In the data universe, solutions like Power BI Copilot, Tableau Einstein AI, and dozens of other more niche tools promise to revolutionize data usage. They position themselves as part of what we call Augmented BI, which promises to “use the transformative power of generative AI to get the most out of your data”. The promise is clear: eliminate the dense (and sometimes tedious) work of understanding data, modeling, user research, report design, etc. It seems all problems are solved, right?
But is it really? The answer depends on your organization’s level of maturity regarding BI. If your company has a solid, structured BI area capable of delivering value accurately and consistently, but struggles to meet the growing demand of stakeholders, you are at the ideal time to implement advanced AI tools. On the other hand, if your organization still deals with silos between areas, inconsistent and divergent KPIs, and weak (or non-existent) modeling, perhaps it is necessary to take a step back. Before adopting Augmented BI solutions, it is crucial to understand how robust BI areas and projects work and how your company can prepare for this transformation.
Let’s understand some definitions.
What is Business Intelligence?
Business Intelligence (BI) is a set of strategies, technologies, and practices that allow companies to collect, analyze, and transform data into useful information for decision-making. The BI concept encompasses various tools and techniques, such as data analysis, data visualization, KPI definition, data governance, and many others, which help organizations to better understand their performance and identify opportunities for improvement.
The democratization of BI tools emerges as a transformative trend, allowing professionals at the business front to perform data analysis independently. A well-consolidated BI environment allows organizations not only to understand historical data but also to predict trends and consumption patterns, essential capabilities in our modern and hyper-connected world. Data visualization is a fundamental pillar, offering real-time interactive interfaces that simplify the understanding of complex information and improve organizational communication.
Organizations at different stages of data maturity require different approaches to BI implementation. From approaches that focus on creating Data Lakes and Data Warehouses to approaches that improve data democratization across the company and automate data analysis and insights for company executives.
For an organization to have a minimally functional and robust BI area, some key points are necessary:
We have a clear understanding of the solid foundations of a robust BI area in an organization. What are the main types of Business Intelligence improvement projects that can be developed in a company? We can subdivide them into 3 main groups:
Let’s understand these types of projects in more detail.
BI Factory: Structuring a Centralized Team to Optimize Business Intelligence
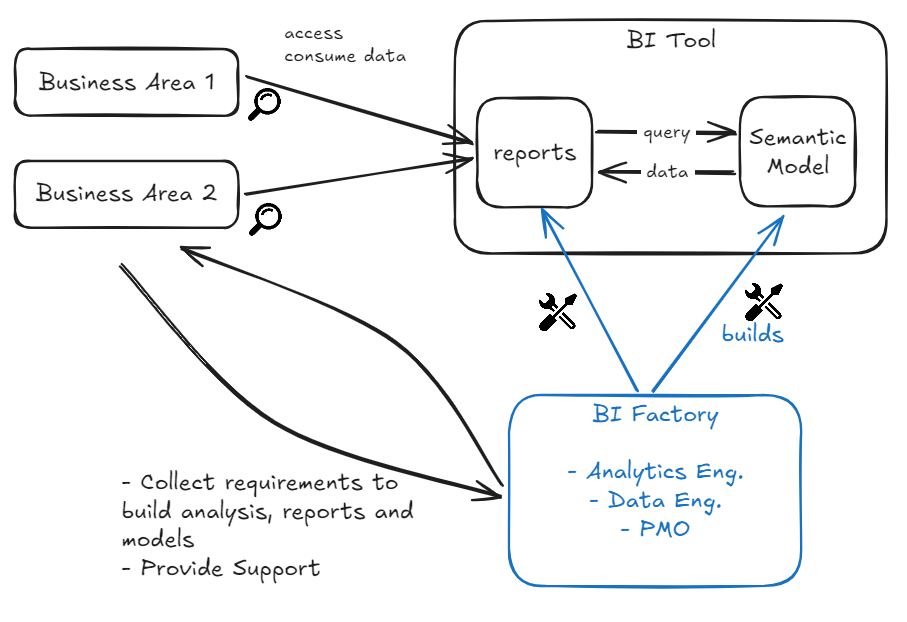
Implementing a BI Factory involves establishing a centralized and multidisciplinary team dedicated to unifying and optimizing BI efforts across the organization. The goal is to consolidate BI practices, and improve the efficiency and quality of analyses, aligning all areas of the company around a cohesive data strategy.
This centralized team’s mission is to coordinate BI initiatives within the company, standardize KPIs and processes, optimize the use of tools, and foster collaboration among different teams. The main advantage is that it enables a more efficient use of resources, ensuring that the generated intelligence is consistent, has a high impact, and supports strategic decisions.This approach fosters the sharing of curated and standardized information, breaking the information silos and ensuring all KPIs are based on a well designed and robust data model. Information becomes available across all company, and discussion focus on business decisions rather than the accuracy of numbers.

However, implementing a BI Factory faces several challenges, such as gaining leadership support, aligning stakeholder expectations, and dealing with budget and resource constraints. To ensure the success of this process, it is essential to carefully plan the implementation phases, including clearly defining roles and responsibilities, selecting appropriate tools, and establishing robust governance.
In the long term, an effective BI Factory facilitates the continuous delivery of insights to different areas of the company (thereby raising the level of data-driven decisions), while maintaining the quality control and agility necessary to respond to constantly changing business demands.
Key characteristics of a BI Factory:
When to consider a BI Factory:
Self-Service BI: Autonomy for Business Analysis with Flexible Data Models and No-Code Exploration
Your company already has a functional BI area, producing high-quality dashboards dedicated to various departments. They are so successful that requests for customization keep pouring in (“can you add filter A and metric B? It’s very important”), questions (“why doesn’t this number match report X?”), as well as new projects. You need to expand the impact of the data-driven culture that your BI area has already helped to implement. How can this be done? That’s where the idea of a Self-Service BI (SSBI) comes in.
Self-Service Business Intelligence is defined by Gartner as “end users designing and deploying their own reports and analyses within an approved and supported portfolio of tools and architecture.” Gartner also defines the similar term Self-Service Analytics as “…a form of business intelligence (BI) in which business professionals are enabled and encouraged to perform queries and generate reports on their own, with nominal IT support.” The definition is complemented with “…it is typically characterized by easy-to-use BI tools with basic analytical capabilities and a data model that is simplified or reduced to facilitate understanding and direct data access.”
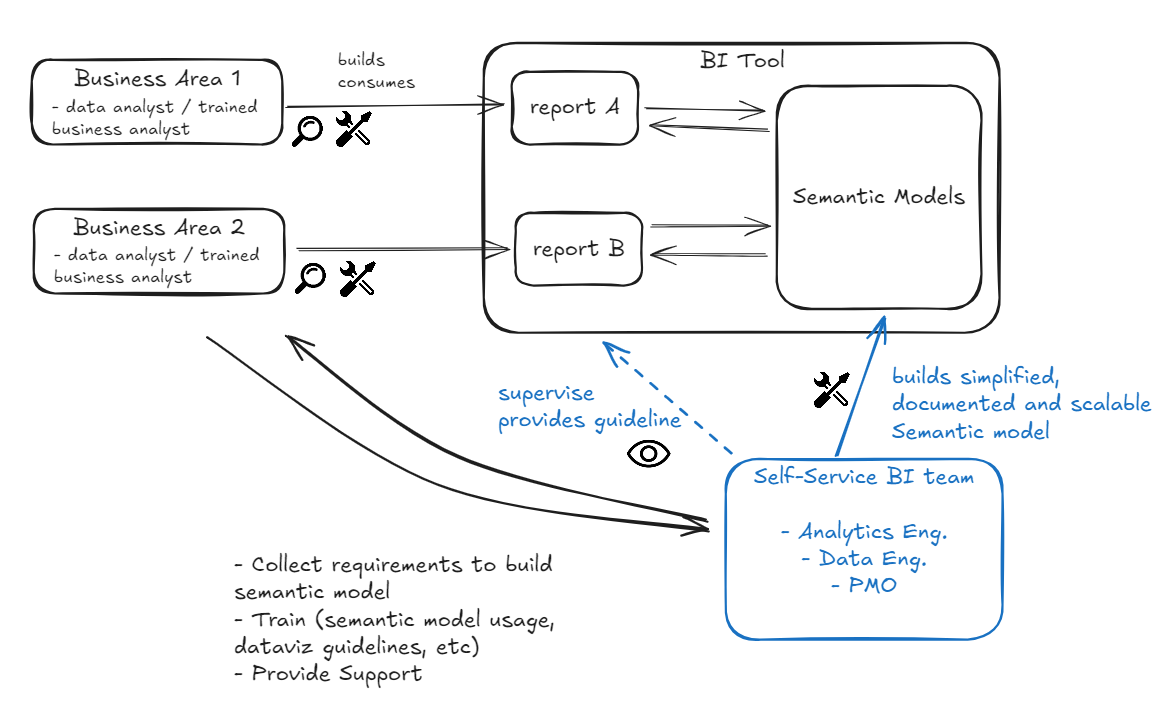
While BI factory’s approach focuses on providing business users with ready-to-analyze reports, the self-service BI’s approach focuses on empowering business analysts to explore the data on their own, and to create the reports in a totally independent way, still ensuring the consistency of the data and the homogeneity between business units. This is the ultimate data silos breaker, since all business units will have access to all data and KPIs that are not restricted by privacy or security reasons.
The goal of SSBI is then to create a robust data semantic layer and encourage end users to build their own dashboards and analyses. However, enabling this freedom for the user brings challenges related to how users will interpret the data provided, whether they will access only information they are permitted to, and whether they will effectively find the information necessary for their daily work.

Giving so much freedom to the end user allows them to mix incompatible concepts, combine uncorrelated data in the same analysis, choose an inappropriate chart to tell the story they are looking for, create reports almost identical to existing reports, or simply give up on the tool due to the complexity of using it correctly. In addition, there is the possibility of unprepared users generating very large queries in the database, freezing the processing for everyone sharing the same server.
It seems like many challenges, but with just three well-applied fundamentals, all of them can be solved: Clear and robust semantic layer, Data Literacy of analysts, and Data Governance:
The implementation of a Self-Service BI is an excellent complement to a BI Factory, giving departments the freedom to explore data in the way they deem necessary to better direct the business, while the central team focuses on the infrastructure and more robust and complex reports.
Key characteristics of Self-Service BI:
When to consider Self-Service BI:
Augmented BI: The Next Level of Business Intelligence
Augmented BI takes business intelligence to the next level by adding AI to your data analysis. While traditional BI gives you reports and Self-Service BI lets teams create their own dashboards, Augmented BI actually helps predict trends and answers questions in plain language. It’s like upgrading from a map to a GPS with traffic predictions.
This advanced approach isn’t a starting point – it works best when built on top of well-established BI systems. Companies should first master basic reporting and self-service analytics before adding these AI-powered capabilities.
Because Augmented BI offers such game-changing benefits for businesses ready to take this step, we’ll explore it fully in our upcoming article. We’ll talk about what is already available, and also what are the trends tomorrow.
Then what should be my next steps?
Start small! While the true value of BI lies in the integration of data from multiple areas, it is essential to begin with a limited, yet structured, dataset to scale. Generating tangible results quickly helps build trust and engagement.
Integrate the approaches. BI Factory, Self-Service BI, and Augmented BI do not need to be mutually exclusive. Together, they create a robust ecosystem: centralized governance, user autonomy, and automated advanced insights. Integrating these strategies maximizes the impact of BI.
Invest in culture and training. Technology only generates value when accompanied by a data-driven culture and empowered users. Training and data literacy are essential to transform information into strategic actions.
Finally, remember that BI is a continuous journey. With planning, integration, and constant learning, your organization will be prepared to transform data into results.
References
-Self-Service Business Intelligence (Gartner). https://www.gartner.com/en/information-technology/glossary/self-service-business-intelligence
-Definition of Self-service Analytics (Gartner), https://www.gartner.com/en/information-technology/glossary/self-service-analytics
-Overview – https://learn.microsoft.com/pt-br/power-bi/create-reports/copilot-introduction

 BLOG
BLOG


